Fix TMS BI Reports with a Single Authoritative Data Map for Logistics
A correct TMS BI integration pushes real-time or near-real-time shipment, cost, and carrier data out of your transport management system and into a business intelligence platform where it becomes visible, comparable, and actionable. The immediate payoff is faster root-cause analysis, tighter cost control, and dispatch decisions made on current numbers instead of yesterday’s export. Platforms like FreightSuite and tools like Microsoft Power BI are the two ends of that pipeline, and the value shows up the moment a delayed shipment or a margin leak surfaces in a dashboard instead of a monthly spreadsheet.
TL;DR:
- Real-time TMS BI integration enables immediate visibility into shipment issues, allowing dispatchers and finance teams to respond before problems escalate.
- KPIs like on-time delivery, lane costs, dwell times, and claims should be prioritized and benchmarked against industry standards for effective dashboard design.
- Data ownership must be clearly defined among systems such as TMS, ERP, WMS, and OMS to prevent conflicting information and ensure reliable analytics.
- Hybrid integration methods combining APIs, EDI, and webhooks are common, with secure OAuth 2.0 service accounts recommended for authentication.
- Proper data mapping, governance, and validation are essential to prevent mismatches, facilitate reconciliation, and maintain trust in dashboards over time.
Table of Contents
- Why TMS BI Integration Matters for Logistics Teams
- Recommended Integration Architecture and Data Ownership Rules
- Integration Methods: APIs, EDI, Webhooks, and Connectors
- Data Mapping, Master Data, and Governance for Reliable Analytics
- BI Workflows and Dashboard Examples: KPIs, Modeling, and Refresh Cadence
- How to Implement a TMS BI Integration Step by Step
- Common Pitfalls and Warnings to Avoid
- FreightSuite: Built for TMS BI Integration From the Ground Up
- Authoritative Documentation and Integration Guides to Consult
- Sources
- FAQ
Why TMS BI Integration Matters for Logistics Teams
Freight forwarders running on spreadsheet exports find out about a problem weeks after it cost them money. A live TMS BI integration flips that timeline. Dispatchers see carrier performance drift before it becomes a pattern. Finance sees landed cost the day a shipment clears customs, not at month end.
The operational gains are concrete: better carrier selection based on actual on-time history, dispatch decisions informed by current dwell times, and fewer manual reconciliations between what the TMS says and what accounting books. On the financial side, integration shortens the invoice reconciliation cycle and gives finance teams a real-time view of freight spend instead of a lagging one.
The KPIs worth building a scorecard around include:
- On-time delivery (OTD) rate by carrier and lane
- Cost per shipment, broken out by mode and customer
- Average dwell time at origin and destination
- Chargeback and claims rate against total shipment volume
Pro Tip: Pick three KPIs your ops team already argues about in weekly meetings and build those first. A dashboard nobody asked for gets ignored no matter how well it’s built.
Government transportation data and industry benchmarking can help you decide what “good” looks like for each metric before you commit them to a dashboard, since a KPI without a benchmark just measures noise. The U.S. Department of Transportation’s research portal is a reasonable starting point for calibrating targets against broader freight performance trends.
Recommended Integration Architecture and Data Ownership Rules
Three architectural patterns dominate TMS BI integration, and each fits a different scale of operation. Direct connectors, point-to-point links between your TMS and a single BI tool, work well when you have one or two downstream systems and a small IT team. They’re fast to stand up and cheap to maintain until you add a third or fourth system, at which point the number of connections grows faster than your ability to manage them.
Middleware or iPaaS (integration platform as a service) sits between your systems and translates data once, then distributes it everywhere it’s needed. This is the pattern most mid-size and enterprise forwarders land on, because it centralizes mapping logic instead of scattering it across a dozen point-to-point links.
Orchestration layers go a step further, coordinating not just data movement but workflow logic, triggering actions in one system based on events in another. This matters more as AI agent orchestration becomes standard in modern TMS platforms.
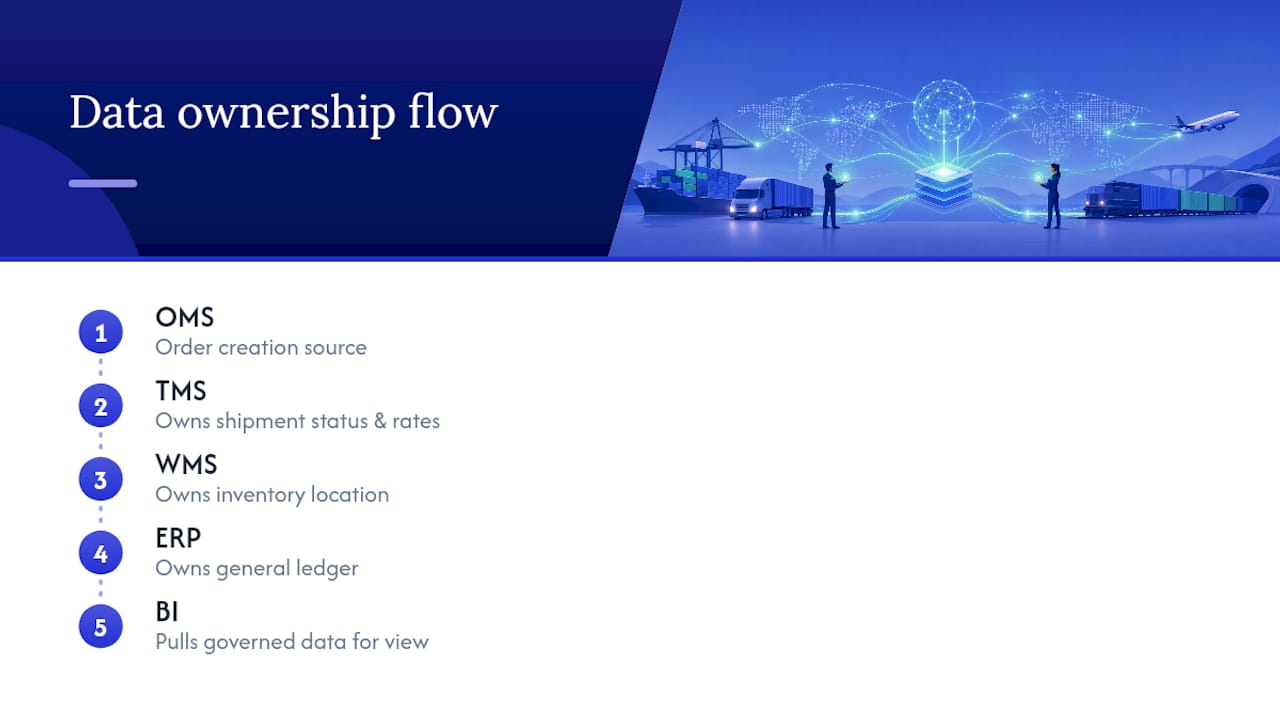
Whichever pattern you choose, one rule matters more than the technology: a single system should be authoritative for each business entity. The TMS owns shipment status and carrier rates. The ERP owns the general ledger. The WMS owns inventory location. Agreeing this in advance, before connectors are built, prevents the conflicting-numbers problem that kills trust in a BI dashboard faster than anything else. Data typically flows from OMS (order creation) into the TMS (execution and tracking), which feeds the WMS for warehouse events and the ERP for financial posting, with BI pulling from all four to build a unified view.
Integration Methods: APIs, EDI, Webhooks, and Connectors
Most TMS BI integration projects use some combination of four methods, and the right choice depends on how fast you need the data and how modern your trading partners are.
- REST APIs with OAuth 2.0 handle real-time sync for shipments, invoices, and documents. Modern TMS platforms organize their APIs around resources like customers, orders, and invoices, and OAuth 2.0 with service accounts is the standard way to authenticate without exposing user credentials.
- EDI and SFTP remain the backbone for legacy trading partners who haven’t modernized. Batch file transfers work fine for reconciliation runs where a few hours of latency doesn’t matter.
- Webhooks and event-driven patterns notify downstream systems the moment something changes, a shipment status update, a rate change, without polling an API on a schedule.
- iPaaS or middleware translators convert older EDI transaction sets like 850, 856, and 997 into JSON that modern REST endpoints can consume, which cuts maintenance overhead significantly once you have more than two or three trading partners on different formats.
Pro Tip: Don’t authenticate every integration with a personal user login. Set up a dedicated service account with OAuth 2.0 scoped to exactly the data it needs. When someone leaves the company, you won’t accidentally break three integrations along with their access.
The practical reality is most forwarders end up running a hybrid: APIs for real-time partners, EDI for the legacy ones, and webhooks layered on top for anything time-sensitive like exception alerts.
Data Mapping, Master Data, and Governance for Reliable Analytics
BI dashboards are only as trustworthy as the data map behind them. Before any connector goes live, you need a documented list of entities (shipments, invoices, carriers, customers), their canonical fields, and which system owns each one. Skip this step and you’ll spend more time debugging mismatched numbers than building reports.
The mismatches that trip up most integrations aren’t exotic. They’re mundane:
- Carrier IDs that differ between the TMS and the accounting system
- Cost center codes that got renamed in the ERP but not updated in the TMS
- Lane IDs formatted inconsistently across regional offices
Academic research on enterprise integration backs this up directly: technical connectors rarely fail on their own. Integrations succeed or stall based on whether organizational roles and data ownership got aligned before the technical work started, not after.
Reconciliation strategies that actually hold up include a crosswalk table mapping every external ID to an internal canonical ID, transformation rules documented at the field level (not buried in code comments), and a change-control process so a schema update in one system triggers a review of every downstream mapping that touches it. Field-level lineage, knowing exactly which system a number in a dashboard originated from, turns a “why doesn’t this match” argument into a five-minute lookup instead of a week-long investigation.
BI Workflows and Dashboard Examples: KPIs, Modeling, and Refresh Cadence
Once clean TMS data lands in a BI tool, four dashboards cover most of what operations and finance teams actually use day to day:
- Carrier performance (OTD rate, damage claims, response time)
- Lane cost trends over time, segmented by mode and customer
- On-time delivery broken down by origin, destination, and carrier
- Claims and exceptions, flagged for aging and dollar exposure
On the modeling side, a star schema built around a central shipments fact table, joined to dimension tables for carriers, customers, and dates, handles the volume and query speed most logistics BI use cases need. Date and time handling deserves special attention: time zones across origin and destination ports cause more dashboard errors than any other single modeling mistake.
For teams building on Power BI specifically, the practical choice is between a gateway (for on-premises data sources) and DirectQuery (for cloud sources that support live querying without importing). Incremental refresh, updating only new or changed records instead of reloading the whole dataset, keeps refresh times manageable once your shipment history grows past a few hundred thousand rows. Vendor examples in freight already show this pattern working: TMS-to-Power BI integrations are common precisely because they turn operational data into scorecards without a custom-built reporting layer. Power BI’s strength in blending TMS operational data with ERP financials also makes it a natural fit for landed-cost modeling, something finance teams building margin reports lean on heavily.
How to Implement a TMS BI Integration Step by Step
Treat implementation as four phases, not one big-bang project.
- Plan. Define your objectives and the specific KPIs you’re chasing. Name the authoritative system for each data entity. Build a RACI so everyone knows who owns mapping decisions, who approves schema changes, and who gets paged when something breaks.
- Build. Choose your integration method (API, EDI, webhook, or middleware) based on partner maturity and latency needs. Obtain API credentials and set up OAuth 2.0 service accounts. Build your field-level mapping document, then run everything through a sandbox before touching production data.
- Validate. Reconcile a sample period manually against the source system before trusting the pipeline. Test edge cases: canceled shipments, partial invoices, multi-leg moves with mixed carriers. Document SLAs for data freshness and write error handlers for the failures you can predict.
- Operate. Set up monitoring and alerts for pipeline failures. Schedule daily reconciliation checks comparing TMS totals against BI extract totals. Maintain a change-control log so nobody modifies a mapping without the team knowing.
Pro Tip: Automate a daily total comparison between your TMS and your BI extract, shipment counts, invoice totals, whatever matters most, and alert on any mismatch above a small threshold. Catching drift early is far cheaper than discovering it three months into a bad dashboard.
Teams that skip validation and jump straight to “operate” are the ones who end up firefighting a dashboard nobody trusts six months later.
Common Pitfalls and Warnings to Avoid
Most TMS BI integration failures trace back to a handful of repeated mistakes, and they’re almost always organizational, not technical.
- No authoritative data map. Without one, master data drifts silently until two reports disagree and nobody can say which is right.
- Weak authentication controls. Sharing a single admin login across five integrations, or skipping OAuth 2.0 entirely, exposes financial and customer records to anyone with that credential.
- Batch-only thinking. Relying solely on nightly exports when the business actually needs same-day visibility leaves dispatchers making decisions on stale data.
- No reconciliation or monitoring. Integrations that run silently with no alerting eventually fail silently too, and you find out when a customer complains, not when the pipeline breaks.
Every one of these is preventable with planning done before the first connector gets built, not after.
FreightSuite: Built for TMS BI Integration From the Ground Up
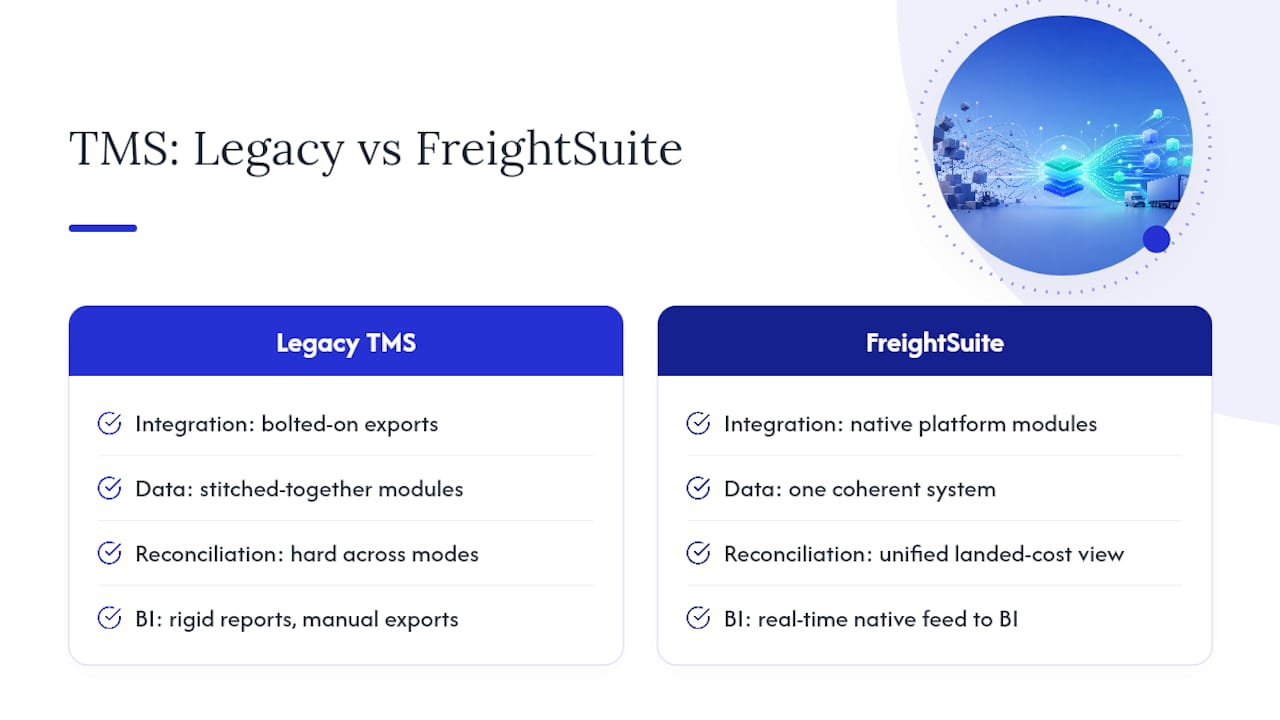
Most legacy TMS platforms treat BI integration as an afterthought, bolted-on exports, rigid reports, connectors that need a developer every time something changes. FreightSuite takes a different approach: rate management, air and ocean tracking, finance, operations, and AI agent orchestration are native to the platform, which means the data feeding your BI tool comes from one coherent system instead of three stitched-together modules.

That matters most in the scenarios that trip up legacy setups: reconciling landed cost across ocean freight and air freight shipments in a single dashboard, or feeding customs brokerage data into a finance team’s margin model without a manual export step in between. Because automation and reporting are built in rather than sold as add-ons, forwarders spend less time maintaining fragile connectors and more time acting on what the dashboard shows. Finance teams get a purpose-built path to landed cost and invoice reconciliation, while operations teams get the same real-time visibility into carrier performance and dwell time discussed earlier in this article.
If you’re currently exporting spreadsheets by hand to feed a BI tool, or fighting a legacy TMS’s rigid reporting module, it’s worth seeing how a freight forwarding TMS built with integration in mind changes that workflow. Request a demo and bring your current dashboard, FreightSuite’s team can walk through what a native, real-time feed into Power BI looks like for your specific lanes and carriers.
Authoritative Documentation and Integration Guides to Consult
Before you scope a project, a few references are worth bookmarking. Microsoft’s Power BI documentation covers data modeling, refresh strategies, and gateway configuration in more depth than any blog post can. For authentication and endpoint structure, TMS vendors typically publish REST API references detailing OAuth 2.0 flows and resource schemas. On architecture, integration-pattern guides covering middleware and iPaaS approaches help frame the ownership and translation decisions covered above, and the FreightSuite resource library carries additional technical breakdowns for teams planning their own rollout.
Sources
- Power BI documentation and product page
- REST API (TMS.ai) documentation
- TMS, WMS, ERP, and OMS API Integration Guide (2026)
FAQ
What Is TMS Integration?
TMS integration is the connection of a transport management system to other business platforms, ERP, WMS, accounting software, or BI tools, so shipment, cost, and carrier data flows automatically instead of requiring manual entry or export.
What Does TMS Stand for in SAP?
In SAP, TMS refers to Transportation Management System, the module that handles freight planning, carrier selection, and shipment execution, and it can integrate with SAP’s broader ERP and analytics tools the same way a standalone TMS connects to Power BI.
What Is TMS in FedEx?
For carriers like FedEx, TMS refers to the transportation management technology used to plan routes, assign carriers, and track shipments, which is a different system from the forwarder-facing TMS platforms like FreightSuite that manage bookings across multiple carriers.
What Is TMS Software Used For?
TMS software manages the operational side of freight movement, rate management, booking, tracking, documentation, and invoicing, and when integrated with a BI tool, that same data powers dashboards for carrier performance, cost trends, and on-time delivery.
How Much Does FreightSuite Cost?
Pricing for FreightSuite is available directly from the company; current details are listed on the FreightSuite website.

