Why Data Matters in Logistics: A 2026 Guide
%20(1200%20x%20700%20px).png)
Data in logistics is the operational foundation that separates profitable freight forwarders from those reacting to problems they could have predicted. Supply chain managers who treat data as a reporting tool rather than a decision engine leave measurable money on the table. AI and Big Data integration improves demand forecasting accuracy by 30%, reduces inventory waste by 25%, and cuts delivery time by 15–20% through better route management. Those numbers reflect a structural shift, not a marginal gain. The industry term for this discipline is logistics data analytics, and it now spans five distinct analytical layers, each more profitable than the last. This guide breaks down exactly how that works, where most teams fall short, and what it takes to build a data-driven operation that actually moves the needle.
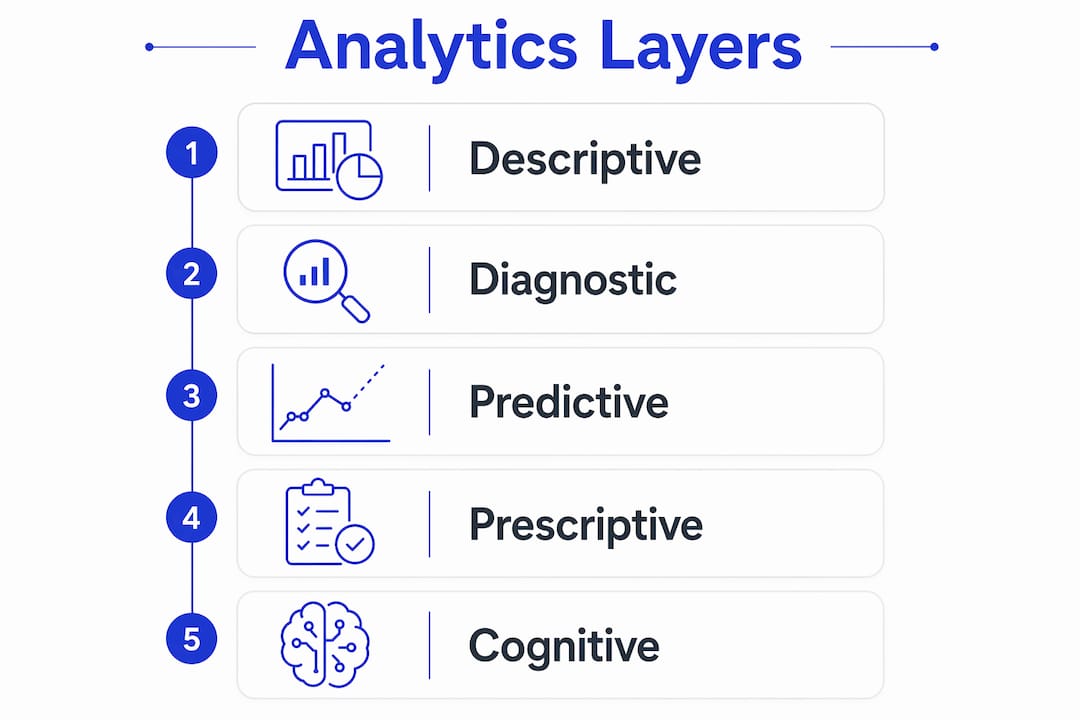
Why data matters in logistics: the five analytics layers
Logistics analytics is not a single capability. It is a progression through five analytical stages, and most teams stall at the first one.
1. Descriptive analytics tells you what happened. It covers shipment volumes, delivery rates, and cost summaries. Most legacy TMS platforms produce this by default. The problem is that descriptive analytics functions more as a cost-center report than a profit driver.
2. Diagnostic analytics tells you why it happened. When a carrier’s on-time rate drops, diagnostic tools trace the root cause to a specific lane, depot, or scheduling pattern. This layer is where freight teams start making decisions rather than just reading summaries.

3. Predictive analytics tells you what will happen. Machine learning models use historical shipment data, weather patterns, and port congestion signals to forecast demand and flag delays before they occur. Companies that adopt predictive analytics report 15–20% cost reductions and OTIF rate improvements of 5–15%.
4. Prescriptive analytics tells you what to do about it. This layer generates specific recommendations: consolidate these three shipments, shift this lane to a different carrier, adjust delivery frequency on this route. Diagnosing and prescribing solutions is where logistics teams unlock real profit potential, far beyond mere metric reporting.
5. Cognitive analytics uses AI agent orchestration to act autonomously on those recommendations. This is the frontier that platforms like Freightsuite are built around, embedding AI natively into workflows rather than bolting it on afterward.
Pro Tip: If your team only reviews analytics during monthly reporting cycles, you are using descriptive analytics as a cost center. Move your review cadence to weekly operational check-ins and connect diagnostic tools directly to your TMS workflows.
The importance of data in logistics becomes clearest when you compare teams at stage one versus stage four. The gap is not just efficiency. It is margin.
What are the biggest challenges in logistics data management?
The single largest barrier to analytics maturity is data fragmentation. Around 50% of logistics companies lack end-to-end supply chain visibility, costing the industry an estimated $184 billion annually. That figure reflects what happens when TMS, WMS, and GPS systems operate as separate silos with no unified data layer connecting them.
The core problems logistics managers face in data management include:
Centralizing and standardizing data across TMS, WMS, GPS, and sensor systems remains the toughest yet most critical task to enable AI and advanced analytics in logistics. The solution is a unified data lake with enforced schema standards, not a patchwork of manual exports and spreadsheet merges.
Pro Tip: Before deploying any AI or predictive model, audit your data sources for completeness and consistency. A 30-day data quality review costs far less than six months of unreliable model outputs.
Which KPIs prove the role of data in transportation?
Logistics performance measurement gives data its business context. Without defined KPIs, analytics produce insights that no one acts on. The table below covers the metrics that matter most, along with industry benchmark targets.
These KPIs do not improve by tracking them. They improve when analytics tools connect the metric to its root cause and surface a corrective action. A carrier on-time rate of 82% is just a number until diagnostic analytics reveals that 70% of late deliveries occur on a single lane during a specific two-hour pickup window.
Most logistics operational improvements do not require major capital expenditure. They arise from better insight into shipment patterns and delivery programming. Case studies show millions in savings hidden inside existing data through behavioural and operational changes, not infrastructure overhauls.
How do you build a data-driven logistics strategy?
Moving from raw data to operational decisions requires a structured approach. The following steps reflect what high-performing logistics teams actually do, not what sounds good in a planning document.
About 70% of logistics companies now use AI for operational efficiency, focusing on transport planning, forecasting, and visibility. Yet only 13% report enterprise-wide transformation. The gap between adoption and transformation is almost always an integration and workflow problem, not a technology problem. Analytics used for slide decks without operational execution provide no real benefit. The Freightsuite operations platform is built specifically to close that gap, with AI agent orchestration embedded natively into daily freight workflows.
Key Takeaways
Data-driven logistics analytics delivers measurable margin improvements only when analytics are embedded in operational workflows, not isolated in reporting tools.
The data advantage most logistics teams are sitting on
I have spent years watching freight forwarding teams invest in analytics platforms and then underuse them within six months. The pattern is consistent. A team deploys a new reporting tool, generates impressive dashboards for a quarterly review, and then returns to managing by exception and gut instinct. The data was there. The insight was there. The operational change never happened.
The shift I advocate for is treating data as a live operational input, not a retrospective record. When your TMS surfaces a carrier performance alert at 9:00 AM on a Tuesday, that alert has value only if someone can act on it before the shipment leaves the dock. If the alert lives in a dashboard that gets reviewed on Friday, it is a history lesson, not a decision tool.
The teams I have seen make the most progress share one trait: they are obsessive about data quality before they are excited about AI. They spend the unglamorous months cleaning carrier codes, standardizing shipment records, and building a single source of truth across their systems. That foundation is what makes predictive and prescriptive analytics actually work. Without it, you are feeding noise into a model and calling the output intelligence.
The window for competitive advantage through logistics analytics is real, and it has a timeline. As AI adoption scales across the industry, the differentiation will shift from “who has AI” to “who has clean data and embedded workflows.” The choice is yours to make now, before that window narrows.
How Freightsuite puts logistics data to work
Freightsuite is built for logistics teams that are ready to move beyond legacy reporting and into genuine operational intelligence.

The Freightsuite AI-native TMS brings rate management, air and ocean tracking, finances, operations, and AI agent orchestration into a single platform. Data from every freight mode feeds into one environment, eliminating the siloed systems that cost the industry billions in lost visibility. For road freight operations specifically, the road freight TMS embeds analytics directly into daily workflows, so your team acts on insights in real time rather than reviewing them after the fact. If you manage freight across multiple modes, Freightsuite connects the data layer across all of them without the integration overhead of legacy systems.
FAQ
What is logistics data analytics?
Logistics data analytics is the practice of collecting, integrating, and analyzing operational data from freight systems to improve decisions on routing, inventory, carrier performance, and cost management. It spans five stages: descriptive, diagnostic, predictive, prescriptive, and cognitive analytics.
How does data improve supply chain visibility?
Data improves supply chain visibility by connecting TMS, WMS, GPS, and carrier systems into a unified view of shipment status, inventory levels, and delivery performance. Around 50% of logistics companies currently lack this visibility, resulting in significant operational and financial losses.
What KPIs should logistics managers track?
The most critical KPIs are on-time in-full rate, cost per shipment, carrier on-time rate, lead time, and route efficiency score. Each KPI becomes actionable only when connected to diagnostic analytics that identifies the root cause of underperformance.
Why do most logistics AI projects fail to scale?
Only 13% of logistics companies achieve enterprise-wide AI transformation despite widespread adoption. The primary reason is poor data quality and analytics tools that are not embedded in operational workflows, so insights never translate into decisions.
How much can data analytics reduce logistics costs?
Companies that move from reactive to predictive and prescriptive analytics report cost reductions of 15–20% and lead time cuts of 10–30%. Most of these savings come from analyzing existing shipment data, not from new infrastructure investment.

