
.png)
Logistics financial reporting is the process of consolidating trip-, lane-, and contract-level operational data into auditable financial statements and management reports that show precisely where freight dollars are earned and lost. For finance and operations teams, this discipline does three things immediately: it surfaces revenue leakage from unbilled accessorials, enables recovery of overbilled carrier invoices, and reconciles route-level profitability against budget. None of that is possible when your TMS and ERP operate in separate silos. Standards like ASC 606 govern when service revenue is recognized, and platforms like FreightSuite are built to enforce that discipline at the transaction level, not after the fact in a spreadsheet.
The core components of a logistics financial report go well beyond a freight-cost line in the general ledger. Trip-level expense grouping rather than generic GL aggregation is what separates a report that drives decisions from one that merely satisfies an audit request.
Each of these maps to a specific ledger account and a specific decision owner. Accessorials belong to the freight cost variance report, owned by operations. Claims belong to the carrier performance report, owned by carrier management. Revenue accruals belong to the revenue recognition schedule, owned by finance. Grouping at the trip or contract level, rather than rolling everything into a single “freight expense” GL account, is what makes those ownership lines visible.
Reliable logistics financial reporting depends on pulling data from the right sources and joining it correctly. Your TMS holds contracted rates and shipment records. Your ERP holds posted costs and GL entries. Your WMS captures storage time and handling charges. Carrier EDI and API feeds deliver invoices and tracking events. Customs filings carry duty and tariff data. Telematics and fleet systems add fuel and mileage. Banks and AP systems close the loop on what was actually paid.

A unified data architecture that connects these sources through an integration layer, a staging and ETL process, a semantic layer that enforces one definition per KPI, and an analytical data warehouse is the minimum viable foundation for audited financial reporting. The semantic layer is the piece most teams skip, and it is the reason two people in the same meeting quote different freight cost numbers.
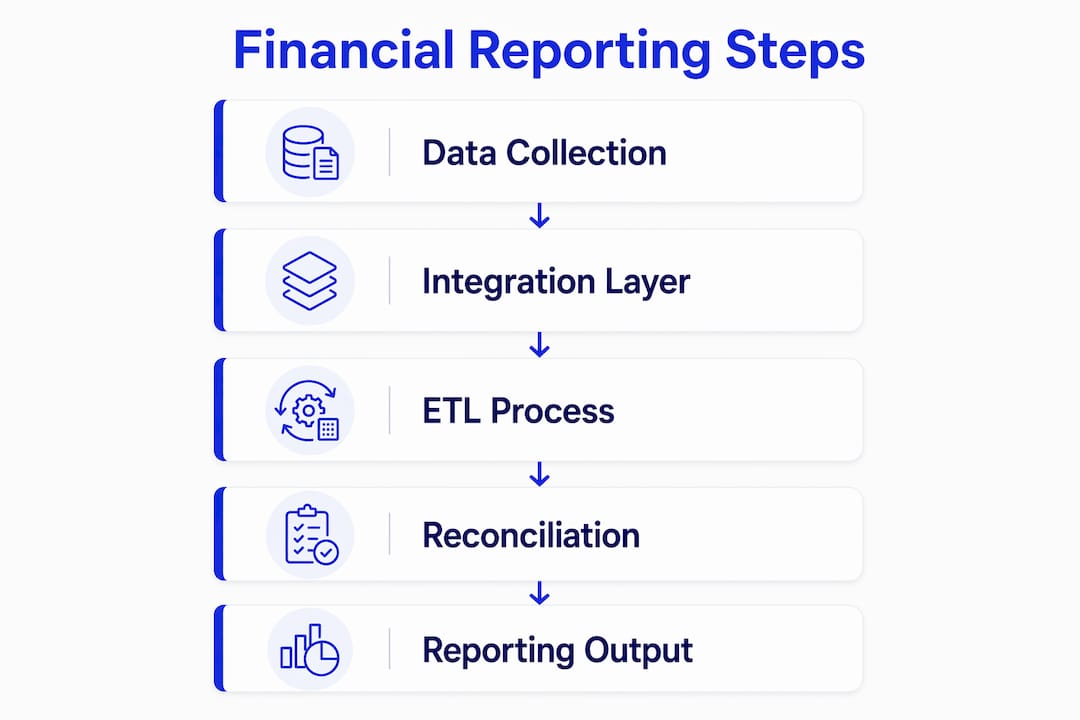
The joins that matter most are TMS contracted rates matched against carrier-invoiced amounts, then reconciled to GL posted costs. When those three figures diverge, you have either a billing error, a rate dispute, or an accrual gap. Any of those three can materially misstate your cost of goods sold.
Pro Tip: Build your integration layer so that every financial transaction carries the originating shipment ID. Without that key, you cannot trace a GL entry back to the trip that generated it, and your audit trail breaks at the first question from a controller or external auditor.
Dashboards built around decision intent outperform dashboards built around available data fields. The goal is 5–8 KPIs per role, each tied to a specific corrective action.
| Metric | Why It Matters | How to Act |
|---|---|---|
| Freight cost per shipment/unit | Tracks true cost-to-serve at the transaction level | Renegotiate lanes where cost exceeds contracted rate |
| Spend by lane | Identifies structural cost pressure across routes or modes | Re-tender high-cost lanes or consolidate volumes |
| Margin by route/contract | Shows which contracts are profitable after all-in costs | Reprice or exit loss-making contracts at renewal |
| Accessorial recovery rate | Measures how much of billed accessorials is collected from customers | Fix billing rules in TMS to auto-apply accessorial charges |
| Variance vs. budget | Flags overspend before it compounds across the period | Trigger a mid-period review when variance exceeds threshold |
| Freight audit savings | Quantifies overbilling recovered through invoice audit | Expand automated audit rules to cover more carrier codes |
| OTIF by carrier/lane | Links operational reliability to financial risk (claims, penalties) | Place underperforming carriers on probation or re-allocate volume |
| Capacity utilization/empty miles | Reveals cost inefficiency in fleet or contracted capacity | Adjust load planning or renegotiate minimum-volume commitments |
Finance teams need the first five. Operations teams need the last three, plus freight cost per shipment as a shared anchor metric. When both functions work from the same grain of data, the conversation shifts from reconciling numbers to deciding what to do about them.
The distinction is methodological, not just cosmetic. Financial reporting produces static, audited, historical records aligned to GL periods. Business Intelligence produces real-time, drill-down views designed for immediate operational decisions. Confusing the two leads to either untrusted reports or compliance gaps.
Use financial reporting when you need to: dispute an overbilled invoice with a carrier and need a GL-reconciled audit trail; close the books for a period and recognize revenue per ASC 606; file a customs duty reconciliation; or present freight cost variance to the CFO.
Use BI when you need to: alert an operations dispatcher that a lane’s cost spiked 20% this week; re-tender a shipment in real time because a carrier missed an SLA; or monitor OTIF across carriers on a live control tower.
A quick checklist to decide which output to build:
The most damaging mistake is mistaking volume for value. A dashboard that exposes every field in your TMS is not a reporting asset; it is noise. Effective reporting targets a defined set of KPIs per role, each tied to a decision.
Manual consolidation in Excel is the second major failure point. Spreadsheets introduce formula errors, version conflicts, and reconciliation cycles that consume finance team hours every month. Automating consolidation and integrating TMS with ERP eliminates most of that friction and improves audit transparency.
Missing accessorials are a silent margin killer. If your TMS does not automatically apply accessorial charges to customer invoices at the time of shipment booking, those charges either get absorbed as cost or billed late, both of which distort your period-end financials.
Inconsistent metric definitions create organizational dysfunction. When finance calculates freight cost per unit differently than operations does, every cross-functional meeting becomes a debate about the numbers rather than a discussion of what to do. A semantic layer that enforces one definition per KPI solves this structurally.
Pro Tip: Design dashboards from the decision down, not the data up. For each role, ask: “What is the one decision this person needs to make?” Then build the KPI that enables that decision. Governance means no new metric gets added to a dashboard without a named owner and a defined corrective action.
The path from ad hoc Excel files to auditable, role-based logistics financial reporting follows a clear sequence. Automating financial reporting and consolidations while ensuring real-time data access is the foundation that makes everything else possible.
Freight operations reporting automation at each stage reduces reconciliation cycles and builds the audit trail that compliance requires.
This checklist assigns owners and milestones so you can start immediately.
FreightSuite illustrates what vendor-grade capabilities look like in practice. Its rate management module holds contracted rates by lane, mode, and carrier, so the TMS can flag invoice variances automatically rather than waiting for a finance analyst to spot them in a spreadsheet. The quote-to-shipment-to-invoice workflow enforces a clean audit trail: a quote accepted by a customer becomes a shipment record, proof of delivery triggers invoice generation, and the system posts to the GL with the shipment ID attached.
The finance team capabilities built into FreightSuite include multi-entity consolidation, freight audit automation, and role-based dashboards that give controllers a reconciliation view and operations managers a lane-performance view, both drawing from the same underlying data store. That architectural choice, one data store with role-differentiated views, is what prevents the “two versions of the truth” problem that plagues teams running separate finance and ops reporting stacks.
For real-time logistics tracking, FreightSuite links POD events to invoice triggers, which improves order-to-cash timing and ensures revenue is recognized only when the service delivery milestone is met, consistent with ASC 606.
A route-level profitability report is the most useful starting point for most finance and operations teams. The schema below covers the fields needed to trace an invoice dispute from the GL back to the trip.
| Field | Purpose |
|---|---|
| shipment_id | Primary key linking TMS, ERP, and carrier invoice |
| origin / destination | Lane identification for spend-by-lane analysis |
| billed_amount | Revenue billed to customer |
| carrier_cost | Purchased transportation cost from carrier invoice |
| accessorials | Itemized accessorial charges (fuel, detention, etc.) |
| claims | Cargo claims and credits reducing net cost |
| margin | billed_amount minus carrier_cost minus accessorials plus claims |
| GL_codes | Posted ledger accounts for cost and revenue entries |
| currency | Transaction currency with FX rate applied |
| recognition_status | ASC 606 status: recognized, deferred, or accrued |
Finance users filter by GL_codes and recognition_status to run period-end reconciliations and confirm that every accrued cost has a matching invoice. Operations users filter by lane and carrier to identify where margin is eroding. When an invoice dispute arises, the workflow is direct: locate the shipment_id on the disputed invoice, pull the TMS contracted rate for that lane, compare it against the carrier-invoiced amount in the carrier_cost field, and post a corrective credit memo to the GL with the same shipment_id as the reference. The audit trail is complete because every entry shares the originating shipment key.
Supply chain dashboards that integrate TMS, WMS, and ERP data into this kind of schema give both functions a shared analytical foundation, which is what moves teams from reactive firefighting to proactive margin management.
Logistics financial reporting works when trip-level data, a semantic layer, and role-based dashboards are built on a single audited data store that connects TMS, ERP, and carrier systems.
| Point | Details |
|---|---|
| Group costs at trip level | Generic GL aggregation hides accessorial leakage; route-level grouping exposes true margin. |
| Enforce one KPI definition | A semantic layer prevents finance and operations from quoting different freight cost numbers. |
| Automate invoice audit | Matching carrier invoices against TMS contracted rates before payment recovers overbilled charges. |
| Build role-based dashboards | Controllers need GL-reconciled audit trails; operations managers need lane cost trends and carrier SLAs. |
| Start a 90-day integration sprint | Connect TMS, ERP, and carrier EDI first; dashboards and governance follow once the data foundation is clean. |
The next practical step is to map your current data sources against the schema above and identify where the shipment ID breaks the chain. If you want to see how FreightSuite handles that workflow end to end, explore the platform or review pricing options to evaluate fit for your team.


