Logistics Cost Visibility: What Supply Chain Managers Need to Know
%20(1200%20x%20700%20px)%20(3).png)
Logistics cost visibility is defined as the real-time ability to track, analyze, and understand every expense component across your supply chain. Without it, logistics costs typically consume 10–15% of total costs for manufacturing companies, and businesses routinely lose 3–5% of freight spend to unidentified discrepancies before those costs ever reach the finance team. That gap is not a rounding error. For a large freight operation, it represents hundreds of thousands of dollars disappearing each quarter. The companies closing that gap are the ones treating cost visibility not as a reporting function, but as a core operational capability.
What is logistics cost visibility, and why does it matter?
Logistics cost visibility is the operational capability to see, in near real time, what you are spending across every shipment, carrier, lane, and mode. The industry term most closely aligned with this concept is freight spend analytics, though logistics cost visibility is the broader practice that connects financial data to operational execution. Both terms describe the same goal: replacing aggregate ledger summaries with granular, shipment-level insight.
The significance is direct. Fragmented data and manual reconciliation delay visibility and control, leaving finance teams reading ledger summaries while logistics teams track service delivery and procurement teams manage negotiated terms. None of those three groups sees the full picture. That fragmentation is where cost leaks live.
Understanding supply chain visibility at this level means connecting operational events to financial outcomes. A shipment that triggers a detention charge, an accessorial fee, or an emergency air upgrade creates a financial impact the moment it happens, not at month end. The organizations that capture those signals in real time are the ones that can act before margins erode.
What components make up a complete cost visibility picture?
Logistics expense tracking covers four primary cost categories: transportation, warehousing, inventory carrying costs, and accessorial charges. Transportation is typically the largest single line item, but accessorial charges, such as fuel surcharges, liftgate fees, and residential delivery premiums, are where unmanaged costs accumulate fastest. They are contractually complex, often inconsistently applied, and easy to miss in aggregate reports.
Granular data is the difference between knowing you have a cost problem and knowing exactly where it lives. Managing costs only at aggregate general ledger levels masks key cost drivers and margin-eroding outliers at the lane or shipment level. A cost spike that averages out across a region is invisible in a summary report but obvious when you filter by lane and carrier.
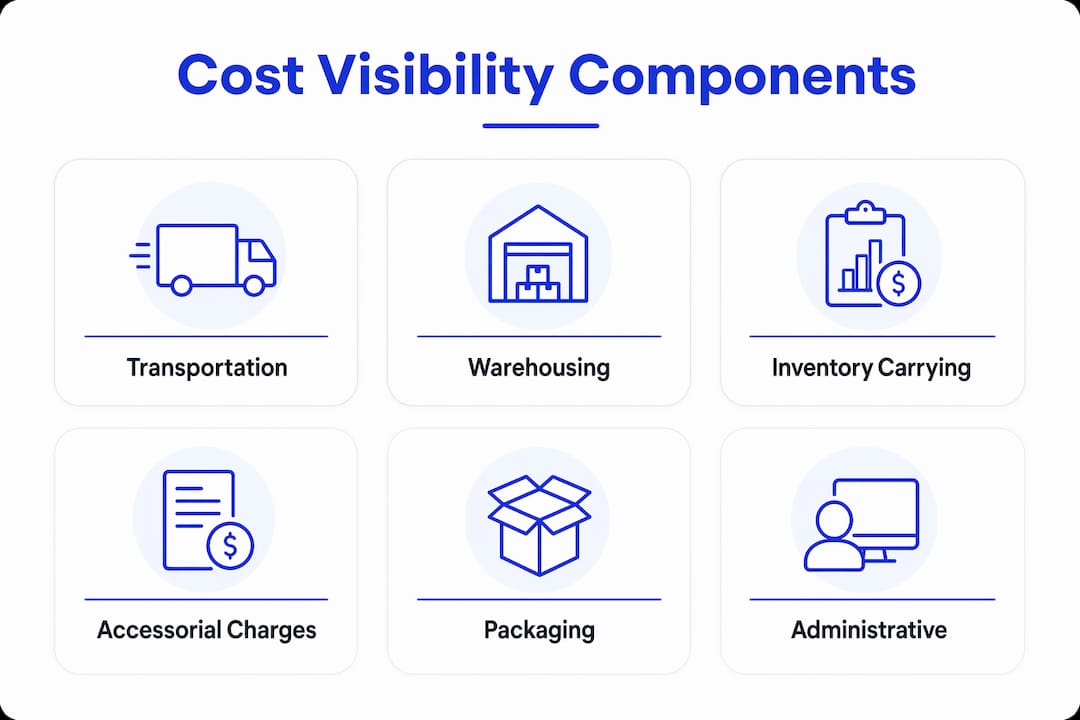
Effective cost visibility dashboards track costs across six critical dimensions:
Analyzing costs at granular levels across these six dimensions is the only reliable way to surface hidden, margin-eroding costs. Without that structure, you are managing averages, not reality.
How does modern technology enable real-time cost visibility?
Traditional month-end finance reports are structurally incapable of supporting cost control. By the time a report lands, the shipments that caused the cost spikes are weeks in the past. The decisions that could have prevented the damage are no longer available.
Real-time cost visibility requires moving from month-end reports to shipment-level data refreshed every few hours, using integration models like Direct Lake that connect operational systems directly to financial validation layers. This is not a reporting upgrade. It is an architectural shift in how logistics and finance data interact.
The key capabilities that make this work include:
Closed integration between operational events and financial systems reduces manual reconciliation and accelerates cost validation. That speed is what converts visibility from a passive reporting tool into an active cost management capability. Freightsuite’s finance team tools are built on exactly this principle, connecting shipment execution data directly to financial workflows without manual handoffs.
Pro Tip: Set your cost dashboard to flag any shipment where accessorial charges exceed 15% of the base freight rate. That threshold catches the most common billing anomalies before they compound across a full billing cycle.
Why does cost visibility prevent budget overruns and cost leaks?
The magnitude of unmanaged freight spend is significant. Businesses commonly lose 3–5% of freight spend to unidentified discrepancies. That loss is not caused by bad contracts or poor carrier performance alone. It is caused by the inability to see costs at the level where the problems actually occur.
“The value of logistics cost visibility lies not in accumulating data but in enabling quick, informed action to preempt margin erosion. Speed of response is the real value, not just the raw data.”
Local optimization, such as focusing solely on cheaper freight rates, often drives higher total logistics costs due to downstream impacts on inventory, detention, or demurrage fees. This is one of the most common and costly mistakes in logistics management. A team that wins a 5% rate reduction on a lane but triggers $40,000 in detention fees has not saved money. It has shifted costs to a place that is harder to see.
The practical steps to prevent this pattern are:
Freight visibility reduces disputes, compresses invoice cycles, and moves carrier relationships from reactive firefighting to strategic quarterly reviews. That shift alone changes the dynamic of carrier negotiations and contract renewals.
What best practices help logistics managers improve cost control?
Activity-Based Costing (ABC) is the most effective costing method for logistics operations. ABC traces logistics costs directly to triggering activities like dock hours or kilometers traveled, providing sharper insight than standard costing averages. The practical result is that you can see exactly which activities, customers, or shipment types are generating cost, not just which cost centers are over budget.
The organizational side of cost visibility is equally important. Logistics cost visibility requires breaking down silos across finance, procurement, and logistics to achieve a single source of truth. That is a process and culture challenge as much as a technology one. The best dashboard in the world produces no value if procurement is negotiating contracts based on data that logistics has already flagged as inaccurate.
Key best practices for building durable cost visibility include:
Pro Tip: Before switching modes or renegotiating a carrier contract, run a 90-day cost-per-shipment analysis by lane. Decisions made from 90 days of granular data are far more defensible than those made from quarterly averages.
How to interpret cost visibility data for strategic decisions
The “Detect, Decide, Act” framework is the most practical structure for operationalizing cost visibility. Experts advocate this framework because speed of response is the real value of visibility, not the accumulation of data. Detection without decision-making is just reporting. Decision-making without action is just analysis. The framework only delivers value when all three stages happen quickly.
Closing the feedback loop between logistics execution and financial performance is what separates organizations that manage costs from those that merely report them. When a carrier consistently generates accessorial charges on a specific lane, that pattern should trigger a contract review, not just a budget adjustment. Cost visibility data makes that conversation factual rather than anecdotal.
Continuous improvement requires monitoring cost trends over rolling periods, not just point-in-time snapshots. A lane that looks acceptable this month may show a clear deterioration trend over six months. That trend is only visible if you are tracking costs at the shipment level with consistent dimensions across time.
Key Takeaways
Logistics cost visibility is the single most effective tool for converting freight spend from an uncontrolled variable into a managed, predictable line item across your supply chain.
The visibility gap most teams are still ignoring
The most persistent challenge I see in logistics cost management is not a technology problem. It is an organizational one. Teams invest in dashboards and data integrations, then fail to close the loop because finance, procurement, and logistics are still operating on different definitions of what a “cost” is and who owns it.
The reconciliation gap between systems is real, but the reconciliation gap between departments is larger. I have seen operations where the logistics team had near-perfect shipment-level data and the finance team was still working from a month-end ledger summary. The data existed. The connection did not. That gap is where the 3–5% freight spend loss actually lives for most organizations.
The shift toward AI-driven workflows is changing this faster than most teams realize. When AI agents can automatically flag billing discrepancies, route exceptions to the right decision-maker, and close the loop with carrier systems without human intervention, the “Detect, Decide, Act” cycle compresses from days to hours. That is not a future state. It is available now for teams willing to move beyond legacy system architectures.
Cost visibility reshapes logistics from a cost center into a competitive advantage. The organizations that get there first are not the ones with the most data. They are the ones that have built the cross-functional discipline to act on it.
How Freightsuite delivers real-time freight cost visibility
Freightsuite is built for logistics managers who need operational and financial data in one place, without the reconciliation overhead of legacy systems.

The platform connects shipment execution across road freight, air freight, and ocean freight to financial workflows natively, so your finance team sees the same cost data your operations team acts on. Rate management, carrier tracking, and invoice validation run in a single system, eliminating the fragmented data problem that drives most freight spend leaks. Freightsuite’s finance team solution is purpose-built to give CFOs and logistics managers the shipment-level cost visibility that month-end reports cannot provide. If you are ready to see what that looks like in your operation, book a demo with the Freightsuite team.
FAQ
What is logistics cost visibility?
Logistics cost visibility is the real-time ability to track and analyze every freight expense across carriers, modes, lanes, and customers at the shipment level. It replaces aggregate ledger summaries with granular data that connects operational events directly to financial outcomes.
How much freight spend do companies typically lose without cost visibility?
Businesses commonly lose 3–5% of freight spend to unidentified discrepancies before those costs reach the finance team. For large freight budgets, that represents a material quarterly loss that compounds without intervention.
What is the “Detect, Decide, Act” framework?
“Detect, Decide, Act” is a three-stage framework for operationalizing cost visibility: surface a cost outlier quickly, evaluate root cause using granular data, and execute a corrective action within the same billing cycle. Speed of response is what makes the framework effective.
What is Activity-Based Costing in logistics?
Activity-Based Costing (ABC) traces logistics costs directly to the activities that trigger them, such as dock hours or kilometers traveled, rather than spreading costs across broad averages. It produces a sharper cost-to-serve analysis that reveals how specific operational decisions affect financial outcomes.
How does end-to-end logistics visibility differ from cost visibility?
End-to-end logistics visibility covers the full physical movement of goods, including location, status, and exceptions. Logistics cost visibility specifically tracks the financial dimension of those movements, connecting operational events to their cost impact in near real time.

